Concreting the EF Class research process
Purpose of this write-up
Originally written as ‘Research at EF Class: A guide to support product designers, project managers and others in the team complete effective research’ and adapted for public release.
During my time at EF Class, the Product team worked hard through a long process of learning what does and doesn’t work in different types of research; the types of things to avoid, how to conduct ourselves as a team, and who to target when. We needed to share this information, as other disciplines in the wider EF company began tackling their own research projects with the same eagerness but unfortunately at the same base level we began at.
But this is fine – we’re only human and life is about learning. Leading this development ultimately built a stronger team who could rely more and more on the results they found, and which other disciplines (such as our development teams, our academic team, etc) within EF Class found, too.
So for the benefit of my colleagues at EF, I wanted to share the blind spots the Product team didn’t realise we had three years, a year, and even six months ago, and the changes we made to counter them.
It's story time!
To really demonstrate where we’d come from, we should go through a brief timeline of our research process:
~2016
Around this time, the EF Class team were not as heavy on research as they could have been. Often this meant speaking to a handful of teachers every year in conversation, and building out full, heavy features based on the curious requirements of a few. Because they had a much smaller user-base, research wouldn’t always be done at the most appropriate phase of a project.

As illustrated by my dear friend from EF Class, Classbot: 


~ 2017
Around 2 years ago, EF Class began speaking to teachers more frequently. Much like 3 years ago, this was usually at the testing phase of a piece of work, instead of before, during and after, but it was certainly a huge step in the right direction. At least now we could test hypotheses and react based on feedback. Not great, but not bad either. A lot more informed than before.


~ 2018
At this point the Product team realised we had not been performing well in our research. We began engaging teachers as a source of knowledge and as an opportunity to learn more about new features or improvements before we shipped them.


The wider team's mindset was slowly shifted. We couldn’t just cover our eyes and pretend everything was fine. We understood that we needed more raw, objective data rather than vague and often incorrect information from our Google Analytics dashboards, and we began experimenting with tools like Amplitude. But we were still falling way short of the mark.
~ 2019
Our new and ever-expanding data warehouse in Amplitude began paying off, and we could understand at a macro and micro level the types of interactions and interests our users had. More importantly for us, we began to see small problems and patterns in the product that we needed to address before they snowballed.


We uncovered a lot of opportunities this way, and used this information to begin prioritising and assigning team members to them. We could even use this insight to target specific types of teachers from our entire gamut, and began meaningful and lengthy dialogues with them.
Around this time, we also began regularly speaking to teachers on a semi-informal basis, just to build out small user personas.
Based on the NN Group’s Landscape of User Research, we’d also finally put together a formalised planning document to determine, concretely and with credence, the types of research we should use against our objectives and the data we want to uncover to progress with a project.
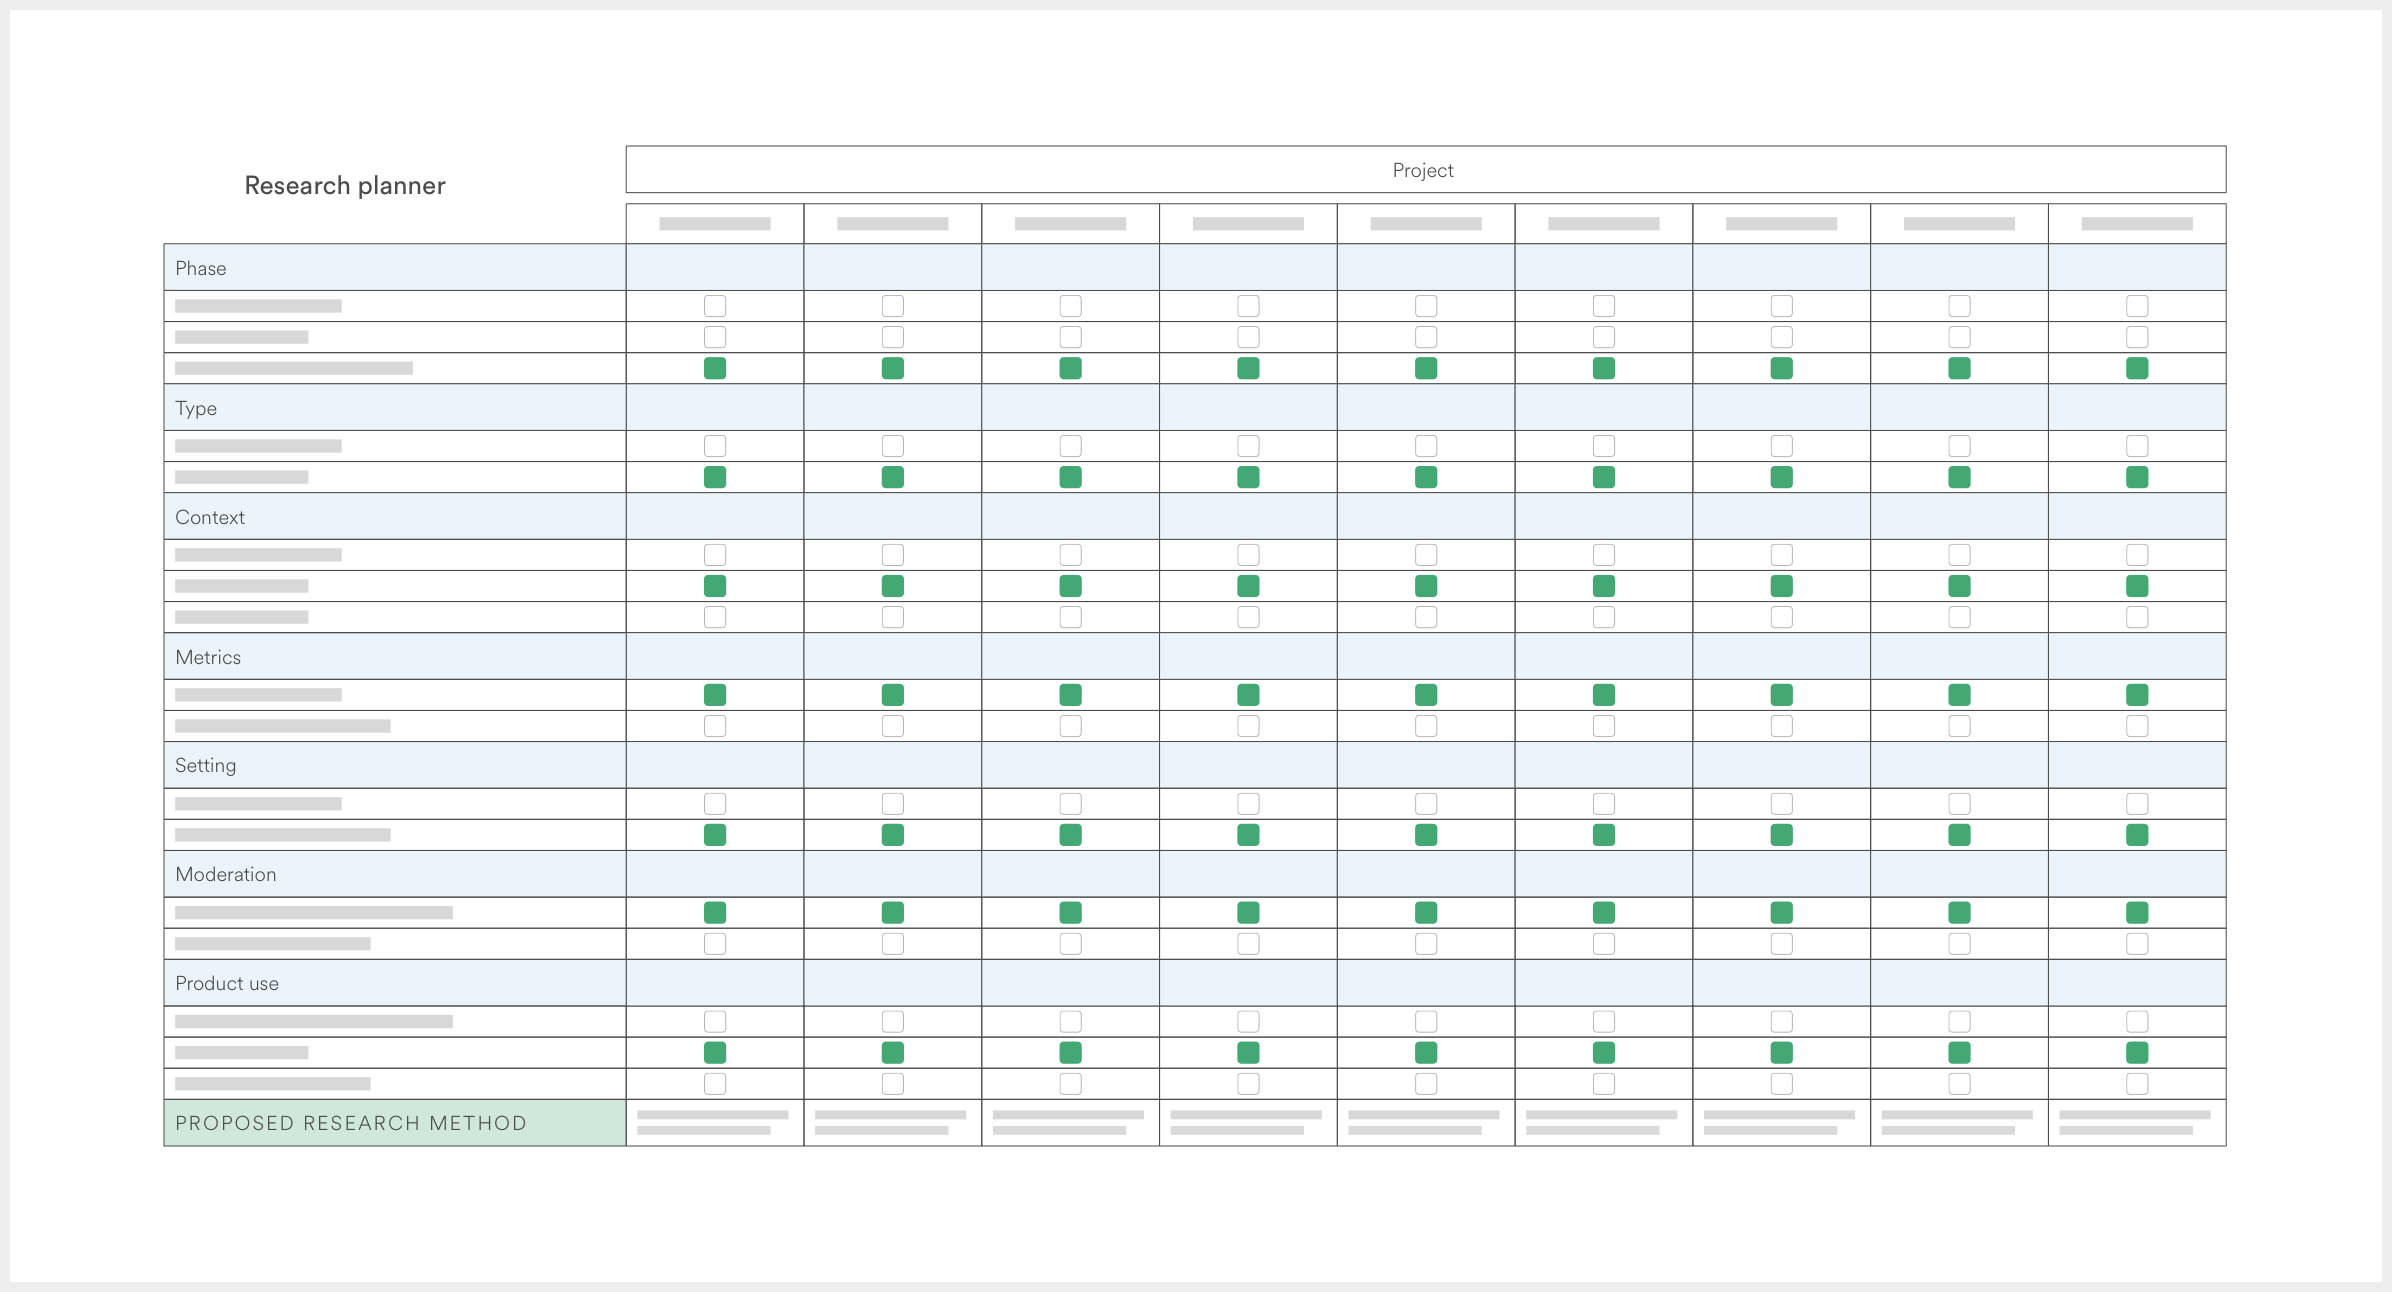
Our very neat and helpful planning document, prettyfied. You can download a blank version of all templates here
At this point, we’d engaged tons of our teachers and had built a bank of around 100 beta test teachers that we could call on at any time we needed people familiar with the product. We were using tools like Maze and guerrilla testing to fill in the gaps. So now that we were using all these new shiny tools paired with a new mindset towards research, this had to be it, right? We’d found our Rosetta Stone and had cracked the code to whatever the hell the Ptolemy of user research was talking about. Right?
So what’s wrong? Why do you get the feeling that it’s all about to come crashing down? Was it that last sentence?

My product team were about to learn of our shortcomings
Surely the new darlings of user research didn’t have a hard lesson to learn? Truth is, we did. We had no method to action our findings beyond sitting in a post-research meeting, speculating over soundbites and long-misconstrued takeaways from our sessions, often days or weeks prior. Different people have their own ways of interpreting opinions, feedback and user reactions. It’s easy to form a bias and listen only for the data points that further promote that bias. It’s hard to argue with raw data, but subjective data can be interpreted in endless ways.
While we’d been building out a good process to begin and execute our research, we’d opened a chasm between any of this research and something we could reliably act on.
Researching the research
We knew we were still coming up short, but didn’t really know where or how. My wonderful colleagues at EF Class and I worked hard to see where the gaps were in our process. This absolutely vital step helped us see all the now obvious mistakes we’d been making at every phase of our research (which all add up!) and also informed how we collated, interpreted, evaluated, and acted upon our findings in four key ways:
- So that it informed a growing bank of research we could act on, agnostic of project
- So that it was accessible to the whole team
- So that the data was standardised in a way that made it clear, accurate, and hard to misinterpret
- So that speculation and interpretation over subjective data was also standardised in some way.
Better believe we’re cookin’ now.
Our new, improved, and always-evolving process
Creating problem statements
No two problem statements are created equally. We might have seen a weird uptick or drop-off on an Amplitude dashboard, received a bunch of messages via email or social media, spotted a trend in some tests we happened to be running for something else, or caught a theme developing across all of our previously captured data. I’m sure there are many other ways we came up with problem statements, but these were probably the top four at EF Class.
Understanding the problem
Once we’d uncovered a problem that we thought was worth (or just needed to be, ugh, no fun) tackling, we had to define ‘what we know, ‘what we think we know’’, and ‘what we know we don’t know’. This usually gave us a rough idea of the depth of the research required. Common questions that helped us at this stage include:
- Is this a new trend/pattern that we’re seeing?
- Or do we have any historical context?
- Do we have any data on this which can confirm, contest, or provide insight into the problem?
Defining our objectives
Depending on the problem statement uncovered, and the project it was coming to become, we’d flesh out the primary objectives of this research either as a squad or as a product team.
We’d then log this in our Research Methodology Planner. This was based on a popular resource by the NN Group and adapted for use within EF Class, making it more specific to our users, needs, and business goals.
By comparing our objectives to the types of data we felt we needed to collect in order to make a strong decision, we could cross-compare against the Landscape Planner to see which types of research we should be using.
Agreeing on the methodology
Christian Rohrer of the NN Group mapped the types of research we can apply to our workflow across 3 axes: 'Attitudinal vs. Behavioural'; 'Qualitative vs. Quantitative'; 'Context of use'. For the sake of this post, I’ll discuss these three axes and how they apply to product research at EF Class, but I won’t go into detail on the specific types of user research the NNG recommends. There are 20, and it will take me forever to get through.
- Attitudinal vs. Behavioural: What people say vs. what people do
- Quant vs Qual: What, how and why? vs. How many?
- Context of use: Natural, scripted, or not at all?
The next choice we needed to make was the type of usage we needed to see in order to get the best results. This is split between 3 categories:
- Natural use of the product: (In situ, or as near as possible). This is generally to minimise interference and increase the validity of what you find, but the main drawback is that you simply cannot control what you learn
- Scripted use of the product: (i.e. a specific rundown of tasks). This is commonly used to test specific pathways or new features.
- Not using the product at all: Things like surveys, general interviews, and other methods to explore ideas larger than pure usability.
We would often use a mixture of all three. Once we had agreed on this, we also needed to put a stake into the stage of product development we were at, something which Rohrer splits into three phases:
- Strategize: 'Inspire, explore and choose new directions and opportunities’
- Execute: ‘Inform and optimise designs in order to reduce risk and improve usability’
- Assess: ‘Measure product performance against itself or its competition’
As I’ve said a bunch of times now, you can read more about the information we adapted on the NN Group’s article ‘When to Use Which User-Experience Research Methods’.
Once we’d done this step, we would come together and check that we’d found the correct methodology type. And then usually smash a packet of cookies.
Writing the brief
In writing our brief, we’d take our learnings from the Research Planning Matrix and transpose those bad boys into a project-specific area in our Google Drive.
First, to further democratise the information (and also to make sure we wouldn’t forget it!) we’d reiterate the objectives, methodology agreed, data required, and product stage. Next we’d agree on how to measure success, and how we would share our findings with the squad and wider team. I took the time out to create a template for these research briefs – as a creature of habit and order, nothing does my head in more than sifting through 40 wildly different styles of documentation. One template to rule them all means the information is in the right place every time. To download a version of this brief, check out this shared folder in my Google Drive.
Working out the logistics
This stage included determining the type of person we had to think about targeting. For instance, did they need to be an EF Class teacher? A power user? A new user? A teacher who’s never used it? Any person with eyes and a computer? Tech savvy? Scared of trackpads? We also needed to consider if we have to prepare the subjects to use any third party software and how to onboard them to it so the test ran smoothly. On top of that, we had to know if we had to produce any design artefacts, and whether we had to create or duplicate any test documents.
We also had to make sure all the proper boring admin stuff had been done well in advance: that invites had been sent, meeting rooms booked, and notetakers prepped.
Writing the test
Over the year leading up to this, I’d built up an ever-growing bank of templates for our test ‘scripts’. Whether the template was literally a script for something like an interview, a task-based test like a survey or card sort, or an unmoderated test on Maze, we always endeavoured to capture the ‘script’ in one standardised place, so everyone involved could find it and feedback easily. But also for posterity; it’s much easier to find past tests if they follow a structure versus if they only live in an archived test, deep in a deprecated third-party design tool.
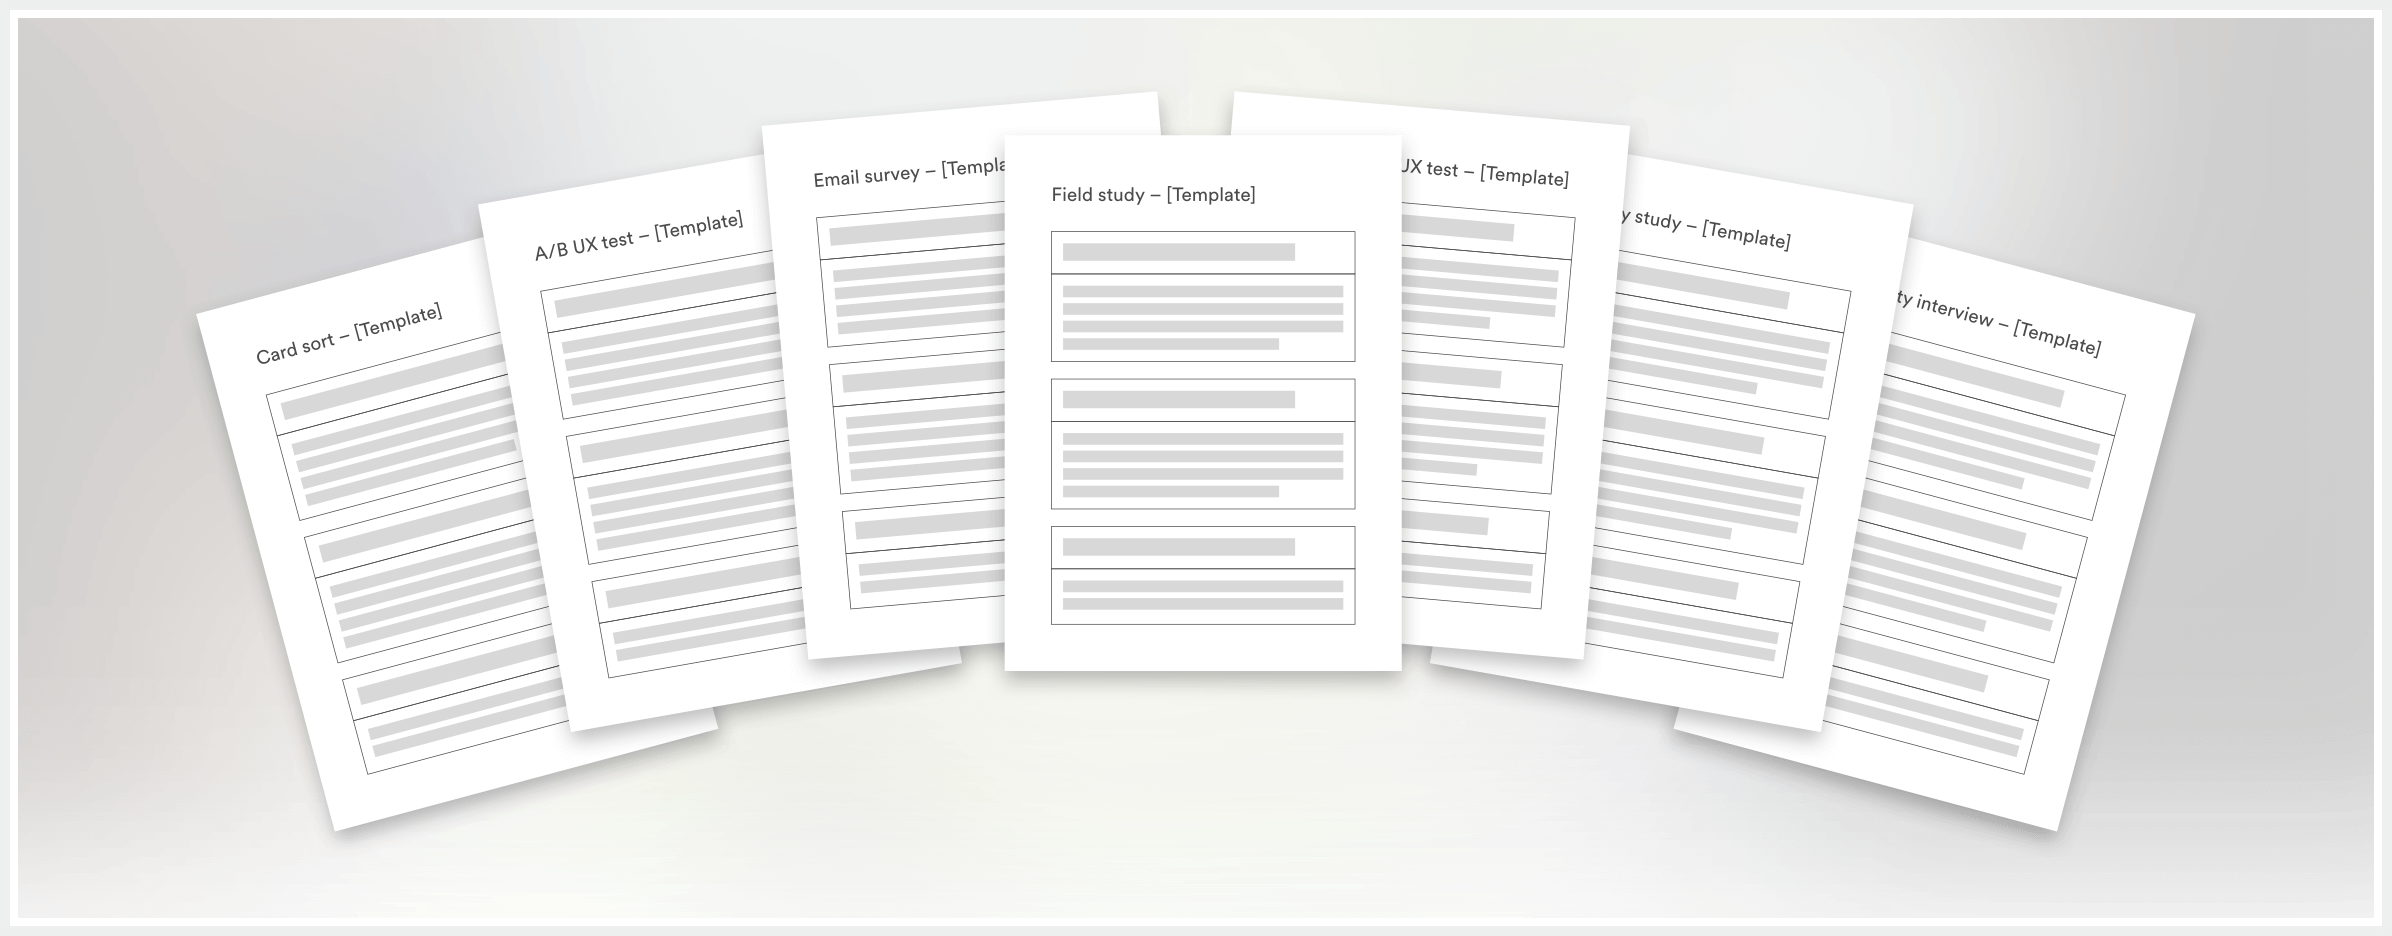
Spend a little now to save a lot later: Building out a bank of reliable, consistent templates made life easier for everyone in the whole team.
All these templates followed the same sort of structure – so we could become easily familiarised with them, and so others on the team could begin to understand them easily.
Running the test
Check your watch… is it 'Story Time with Konnaire' again? I reckon it might be. Let me spin you the yarn of how I changed our approach to one particular type of research, usability interviews, to really drive home how far we came in our process.
Imagine if you will – you’ve been asked to attend a testing session for a product you use. When you arrive, or join the call, you are already out of your regular workplace and situation where you might use the product.
Then you see a bunch of people observing you on camera, watching your every move. Let’s not forget that English isn’t your first language. You’re gonna be a little weirded out.
We were throwing all this at our subjects and expecting to get good, reliable results. Not happening. Even the most confident person is still two levels removed from a normal situation. While it’s a good idea for every discipline of the product to be represented in these kinds of things, it’s a poor choice to have so many people visibly observing.
What’s gonna help you relax into the session more? Your screen becoming flooded with faces and distractions, or just being allowed to have a friendly conversation and crack on with the task?
I still unquestionably believe that every discipline should be represented in as many research sessions as possible – even more so with a squad mentality. But I made sure we only allowed a maximum of three people present in the session: the subject, the moderator, and someone with their camera and microphone off, taking notes. In reality, as many people as we wanted could join the room with the notetaker. They were instructed to pass their comments and questions to the notetaker, who in turn gets an opportunity to speak at the end of every section of the session.
The goal of this shift in approach was to give the moderator freedom to engage in a more natural conversation with the subject, where the product just happened to be the focus, and to negate the idea that the subject is under any scrutiny. Ideally, this allowed them to relax into the session and provide more reliable feedback.
We applied the same thinking across all of the main types of research we undertook.
Analysis – Stage 1
At this stage, there are two main routes we can take:
Route 1
This is where we captured abstract, quantitative data, which should be less up for debate. This usually required a short recap session with the product team or squad before moving onto Analysis – Stage 2.
Route 2
After we ran any research session where we collected qualitative data, we immediately tried to capture the high-level information in our Analysis document. Again, this was a standardised document designed to be broad enough for most types of research.
The moderator’s job after each research session was to jump into the analysis document and write their high-level findings up, using the notes taken from the session and video recording where available. This allowed us to capture the key information from the session into three groups:
- Global trends over categor
- Trends over an entire session
- Global trends over demographic
Once a group of sessions had been completed, the moderator’s next job was to begin identifying these trends. While this is ongoing, we encouraged squad or team members who were not present in a particular test to watch through the video and agree with/challenge the high-level findings and patterns the moderator had found. The reason we asked non-attending members to do this is simple: we wanted their fresh, impartial eyes in order to avoid the Dreaded Bias.
Analysis – Stage 2
Once we came to an agreement within our analysis document, we moved into the final stage of our research process: identifying trends and creating problem statements.
This involved us jumping on over to Miro to complete this work as a squad. Here we pulled out the high level findings from each test and grouped them into their trends.

The three step process we used to capture reliable information, time and time again, for all types of research
This enabled us to do three very powerful things:
- Identify which things we should be tackling immediately by showing us a clear list of priorities
- Identify clear trends which do not necessarily belong or need to be tackled in this project
- See, at a glance, trends and needs over the entire product as we add more and more research findings and group them.
Measuring the success of our research
'So how do we determine if this piece of research was a success?' Nope, let's throw that terrible attitude in the bin with a simple flowchart:
We are fallible and imperfect. We were not born with this knowledge, and we always need to find areas to improve. Different methods also work with varying results based on the team, product, and users. The only important thing is that retrospectives are taken at the right time, and that we are always pushing hard to get better.
Special thanks to Chris Powell for instilling this mindset in our team, to Margarida Sousa and Sam Couto for the autonomy to fix these things, and to Emmanuelle Savarit for all the pointers.


